
AI Powered Conversational Analytics Platform
Business teams often wait for an analyst or a new report just to answer a follow-up question. Vyntics built an AI analytics platform where authorized users ask questions in everyday language and get charts, tables, and clear calculation details.
- Client
- Confidential
- Focus
- AI, Conversational Analytics, Business Intelligence, Data Governance, Self-Service Reporting, Semantic Layer
Most companies have plenty of reports, yet new questions still take time to answer. Someone wants a different comparison, a deeper breakdown, or a quick follow-up, and it often ends up in an analyst's queue. Vyntics built an AI-powered analytics platform that lets authorized users ask business questions in everyday language and explore the answers through charts, tables, and supporting explanations, while still seeing how every result was calculated.
The Business Challenge
The organization already had an extensive reporting environment. The difficulty was that answering a new question often required an analyst to investigate the data or build another report. Existing dashboards covered the familiar questions well, but they were less flexible when someone wanted a different comparison, a deeper breakdown, or an immediate follow-up.
Inconsistent Definitions
Another challenge was consistency. Business definitions and calculation rules were built into individual reports, so differences in filters, date ranges, or metric definitions could make results from two reports hard to compare. People could end up debating the numbers instead of acting on them.
What the Organization Needed
The organization needed a simpler way for people to explore its data, with clear calculations and appropriate access controls.
The Solution
Vyntics developed a conversational analytics platform that lets users describe what they want to understand without writing database queries. A user can ask about a business metric, compare periods, or request a breakdown. The platform interprets the question, checks it against supported metrics, and retrieves the relevant results.
What an Answer Includes
An answer can include headline figures that summarize the result, and charts suited to the type of comparison. It also includes detailed tables for further investigation and written explanations supported by the calculated results. Information about the filters, dates, and definitions used is shown as well, so users can see what each number is based on.
Exploring Further
Users do not have to stop at the first answer. They can ask follow-up questions, inspect the underlying records, or export the results for further review.
A Shared Foundation for Business Metrics
The platform is built on a semantic layer. This is a shared set of definitions that describes what each business metric means and how it should be calculated.
A More Controlled Path to Answers
Instead of asking the AI to invent a calculation or write unrestricted database queries, the system directs it toward these defined business metrics. The application logic then validates and runs the request. This creates a more controlled path from a question to an answer, and it gives the team one central place to maintain calculation rules as reporting needs change.
Asking for Clarification
When a question is ambiguous, the assistant can ask for clarification instead of silently choosing an interpretation. This helps avoid the situation where a user gets a confident answer to a question they did not actually ask.
How It Works
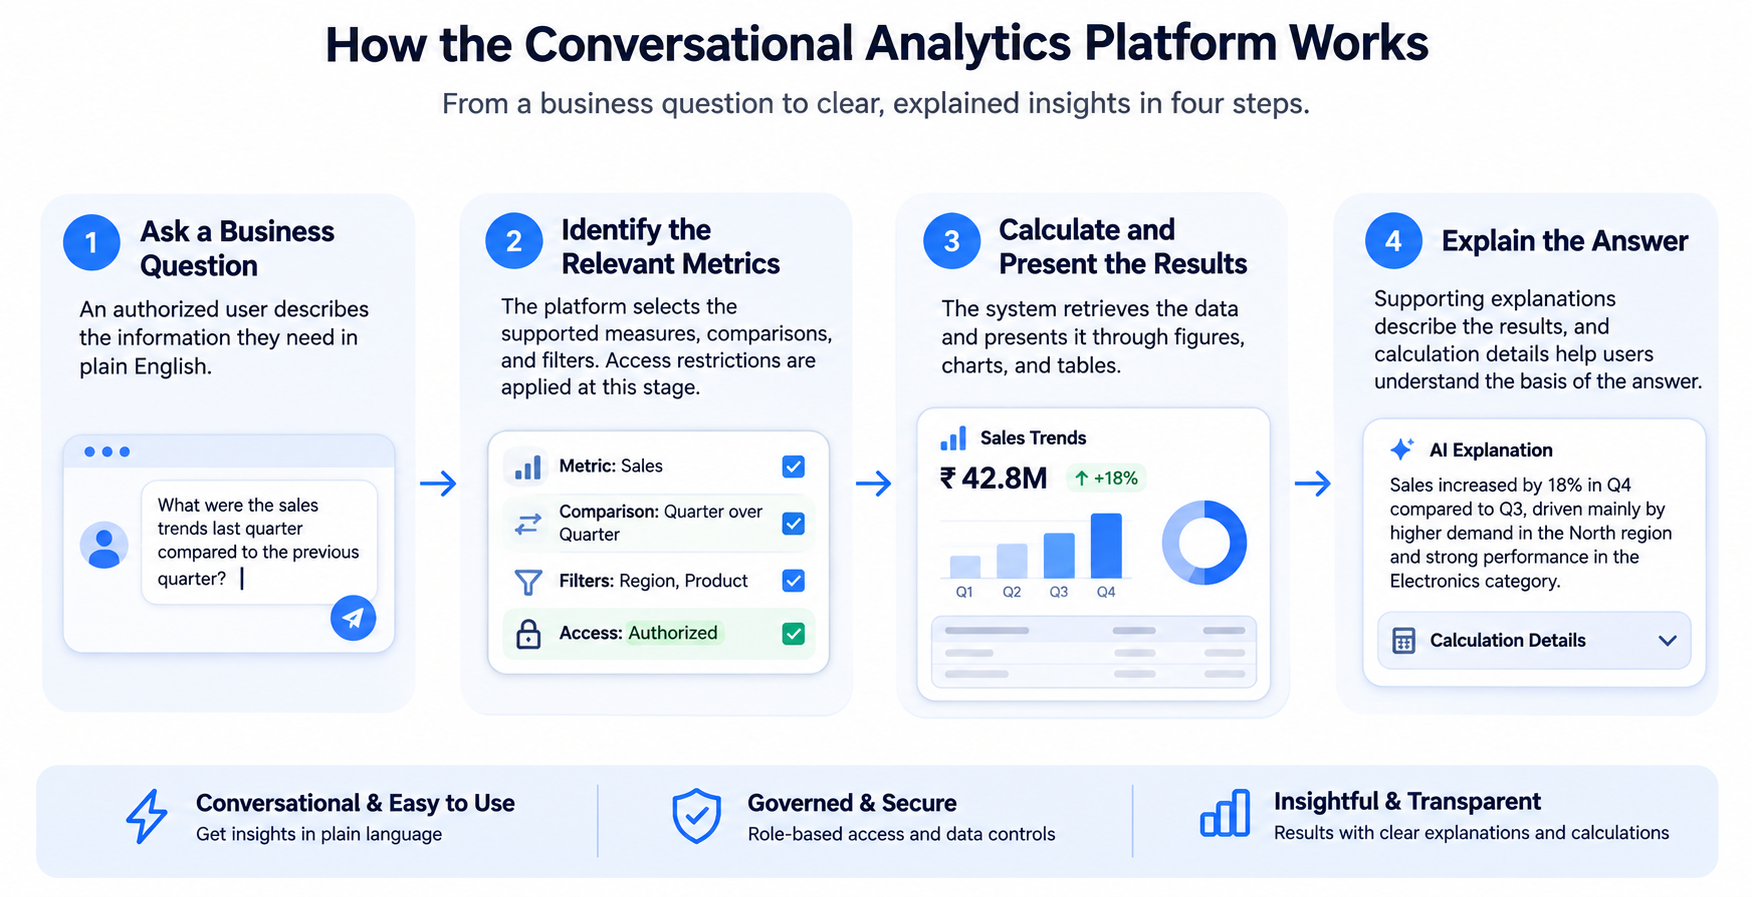
The experience follows five simple steps, and each one is designed to keep the user in control of what they see.
Ask a Business Question
An authorized user describes the information they need in plain English.
Identify the Relevant Metrics
The platform selects the supported measures, comparisons, and filters. Access restrictions are applied by the application at this stage.
Calculate and Present the Results
The system retrieves the data and presents it through figures, charts, and tables.
Explain the Answer
Supporting explanations describe the results, and calculation details help users understand the basis of the answer.
Explore Further
Users can ask follow-up questions, examine the underlying records, or export the information, so one question can lead naturally into a longer investigation.
Trust and Access Control
Making data easier to explore also means being clear about who is allowed to see what. The platform supports different user roles and applies data-access restrictions in the application logic. Individual users can be limited to their own business information, while authorized staff have broader reporting access.
Visible Calculation Choices
The experience also makes important calculation choices visible. Users can review the date basis, the filters that were applied, and the data coverage, instead of receiving a figure with no explanation.
Explanations Based on Calculated Results
The AI-generated explanations are instructed to use computed evidence. These controls support review and traceability, but they do not establish that every interpretation is correct. People remain responsible for judging the results before acting on them.
Business Value
The platform gives teams practical support in four areas.
A More Direct Route to Business Information
Users can explore supported questions through conversation. This gives them an alternative to requesting a new report for every variation of a question.
More Consistent Metric Definitions
Centralized calculation rules help reduce the differences that appear when the same logic is maintained separately across many reports.
Answers That Can Be Investigated
Charts, detailed records, and calculation explanations help users examine a result before they act on it.
A Connected Analysis Workflow
Questions, follow-ups, comparisons, and exports all sit within the same experience, which supports one continuous investigation instead of a series of separate requests.
What to Keep in Mind
These benefits describe the capabilities that were delivered. Measured time savings, adoption, and financial returns were not part of the project information, so this case study does not claim them. Data freshness depends on the underlying reporting data. Complete reconciliation with all previous reports is still subject to validation.
Make Your Business Data Easier to Explore
Does your team depend on analysts or additional dashboards whenever a new business question comes up? Talk to Vyntics about a conversational analytics solution built around your business definitions, reporting needs, and access requirements. [Discuss your project with Vyntics](#).
Technology
- Frontend
- Backend
- AI model
- Database
- Data warehouse
- Semantic layer tool
- Charting library
- Hosting
Have a similar business requirement?
Talk to our team and explore how we can help you solve it.