VYNTICS

Analytics & BI

Turn Your Data Into Better Decisions With BI

Our business intelligence services connect trusted data to dashboards, reporting, and analytics, so teams can review performance and leaders have a clear view of the decisions ahead.

Analytics & BI

Analytics Problems We Solve

From disconnected reports to unclear metrics, we help teams build a reporting setup they can use for everyday decisions.

  • Fragmented Reporting

    We connect reporting across your business systems, so teams can review the information they need without piecing together separate reports.

  • Inconsistent Metrics

    We define shared KPIs, calculation rules, and data ownership, helping teams work from consistent numbers across dashboards and reports.

  • Manual Reporting

    We connect data sources and automate repeatable reporting steps, with checks and clear refresh schedules instead of repeated manual exports.

  • Limited Visibility

    We build focused executive and operational views, so decision makers can review performance, spot gaps, and ask useful follow-up questions.

Analytics & BI

Our Analytics & BI Services

Services
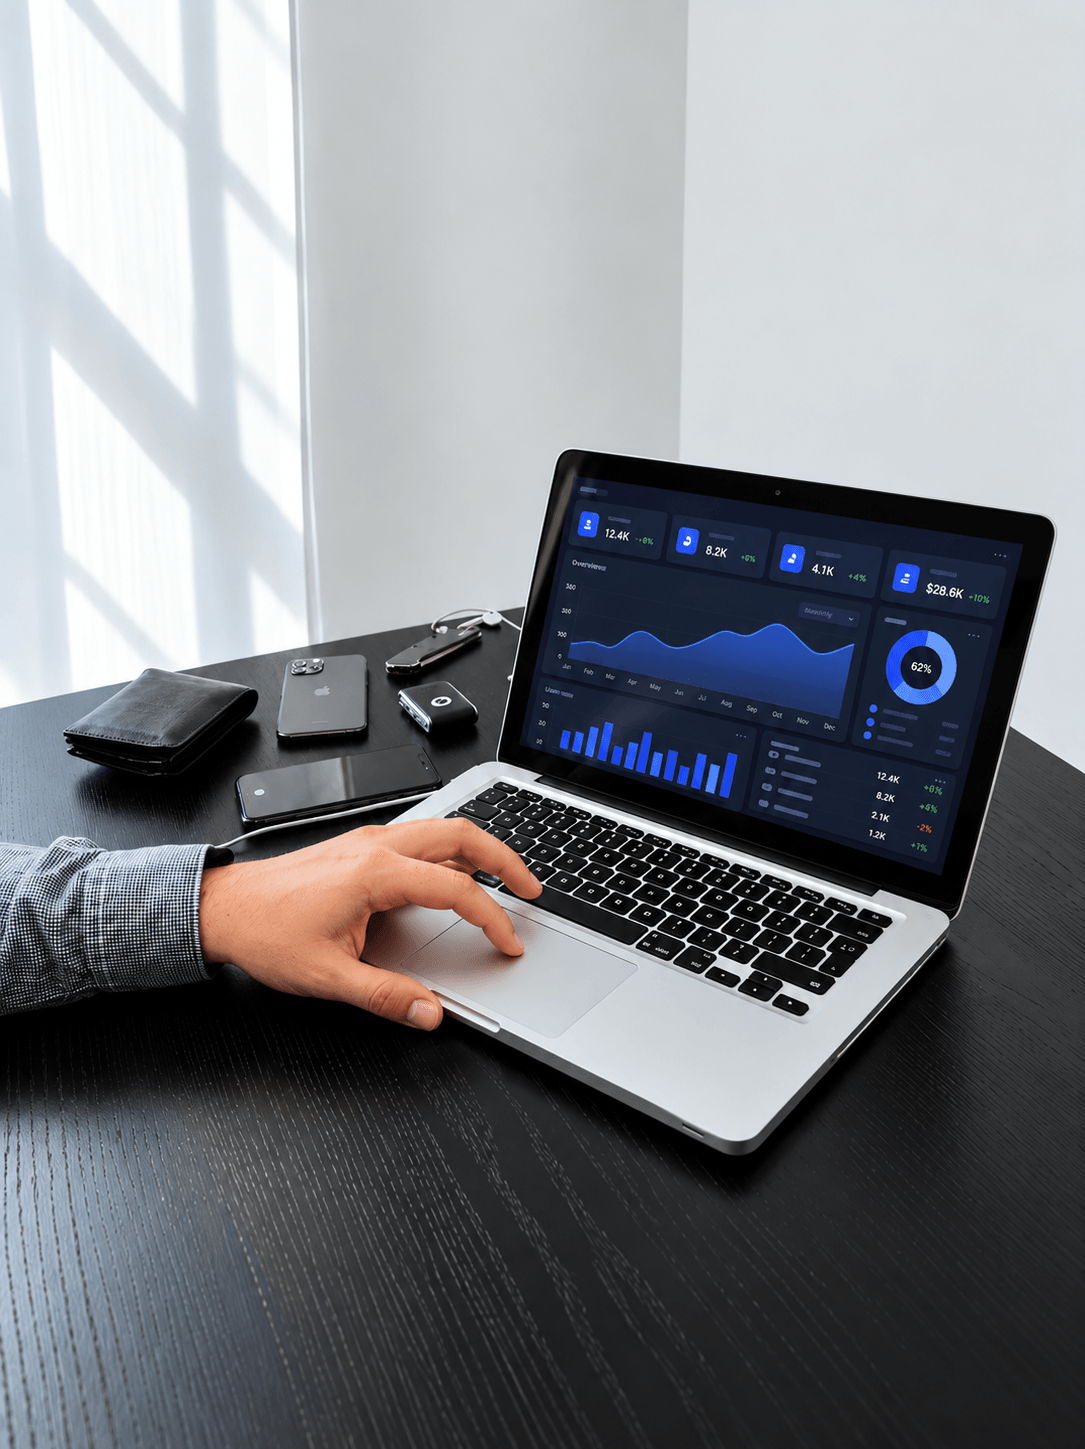
Laptop displaying an analytics dashboard with charts and KPI summaries.Analytics & BI

Dashboards & Executive Reporting

Give leaders and operational teams a clear view of performance. Our data visualization services bring KPI dashboards, executive reporting, and automated reports together around the questions people need to answer.

Here's how we do it:

  • Custom KPI dashboards
  • Real-time dashboard views
  • Embedded dashboards in your apps or portals
  • Automated weekly and monthly reporting
  • Board packs and executive summaries
  • Scheduled email reports
  • Mobile-friendly reporting views

Explore Dashboards & Executive Reporting
Vyntics team reviewing analytics and BI reports together around a laptop.

Why choose us

Why Vyntics for Analytics

As a business analytics company, we connect your data, reporting, and decisions.

  • Decisions First

    We start with the questions your team needs to answer, then shape the metrics, reports, and dashboard views around them.

  • Consistent Foundations

    Connect existing data systems with shared KPI definitions and checks, so reporting has a clear, maintainable foundation.

  • Clear Visualization

    Focused dashboard design makes comparisons, trends, and exceptions easier to review without crowding the screen.

  • Support Beyond Delivery

    Connect implementation with training, documentation, and ongoing support as your data sources and reporting needs change.

Analytics & BI

BI Tools We Work With

We choose tools for business intelligence solutions around your data, reporting needs, existing systems, and team skills.

Amazon QuickSight

AWS and embedded BI

For teams using AWS or embedding analytics in their applications, with setup and dashboard delivery.

Power BI

Models and reporting

For connected KPI reporting, with data modeling, DAX, dashboard setup, and Power BI Service guidance.

Tableau

Visual exploration

For interactive dashboards and data exploration, with setup, performance tuning, and publishing support.

Our approach

How We Work

Five practical stages, from understanding your reporting needs to supporting the BI solution your team uses.

  1. Step 01Discover

    Discover

    Review your reporting questions, data sources, current metrics, and the decisions your team needs to make.

  2. Step 02Design

    Design

    Define KPIs, reporting standards, data models, and dashboard layouts around your users and business priorities.

  3. Step 03Build

    Build

    Connect data, implement dashboards and reports, and validate calculations, refreshes, and access with your team.

  4. Step 04Train

    Train

    Help your team use the reports, understand metric definitions, and manage everyday questions and updates.

  5. Step 05Support

    Support

    Review reporting issues, maintain the BI setup, and refine dashboards as your data and decision needs change.

CASE STUDIES

Case Studies

Explore how data analytics services, reporting, and connected systems help teams work from information they can use.

Loading case studies…

Explore all case studies

RELATED INSIGHTS

Related Insights

Related insights will appear here when available.

Frequently Asked Questions

Practical answers about business intelligence services, choosing a BI tool, reporting foundations, and delivery scope.

Can’t find the answer you’re looking for?

Reach out to us at contact@vyntics.com and we’ll be happy to help.

What do business intelligence services include?

Business intelligence services can include KPI definition, data models, dashboards, automated reporting, tool selection, training, and support. We shape the work around your reporting needs, available data, and the decisions your team makes.

What is the difference between BI and data analytics?

BI usually focuses on consistent reporting and visibility into business performance. Data analytics explores patterns and questions in more depth. The two work together: shared metrics and trusted data support both everyday reporting and further analysis.

How long does it take to set up BI?

Timing depends on your data quality, source systems, reporting scope, access requirements, and chosen tool. We review those first, then agree a delivery plan that covers data connections, dashboard design, validation, and team training.

How much do BI services cost?

Cost depends on the number of data sources, reporting complexity, tool licensing, implementation work, and ongoing support. We review your priorities and current setup before defining the scope, so you can assess the proposed work and costs.

Which BI tool is right for our business?

The right tool depends on your existing systems, reporting needs, user skills, budget, and plans for embedded analytics. We assess Power BI, Tableau, and Amazon QuickSight against those requirements before recommending an approach.

Do we need a data warehouse before setting up BI?

Not always. A focused reporting setup may use existing data sources directly. A warehouse becomes useful when several systems need consistent history, shared definitions, or more demanding reporting. We assess the data foundation before adding another layer.

Analytics & BI

Make Your Reporting Work For The Decisions Ahead

Tell us about your reporting challenges, dashboard requirements, or BI strategy. We can review your data and analytics needs together and identify a practical starting point.